Directions for questions 1 to 5: Refer to the following pie chart and solve the questions based on it.
Following is the cost analysis of a book “BellCAT’s Guide to Quantitative Aptitude for CAT”.
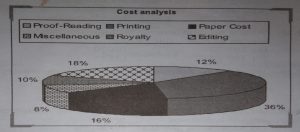
Q.1. What is the central angle showing the cost of paper?
(a) 42.8°
(b) 32.6°
(c) 36.8°
(d) 57.6°
Q.2. If the cost of printing is Rs 23,400 what would the cost of royalty be?
(a) Rs 6500
(b) Rs 2340
(c) Rs 4680
(d) Rs 7840
Q.3. If the miscellaneous expenditure amounts to Rs 18,000 then what is the expenditure on editing?
(a) Rs 8000
(b) Rs 14400
(c) Rs 46800
(d) None of these
Q.4.The royalty on the book is less than the editing expenditure by
(a) 8%
(b) 80%
(c) 44.44%
(d) None of these
Q.5. If 5500 copies of the book are published and the miscellaneous expenditure amounts to Rs 36,960 and the marked price is 40% above the cost price, then the marked price of each copy is
(a) Rs 122.50
(b) Rs 117.60
(c) Rs 126.40
(d) Rs. 92.40
Directions for questions 6 to 10: Refer to the following pie charts and solve the questions based on it.
The pie charts given below represent the market share of different players in the electronics market in the year 1995 and 2000. A new player F has entered the market in the given period.
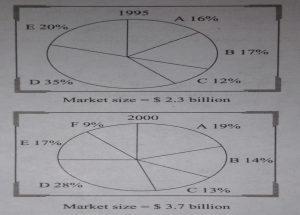
Q.6. What is the percentage increase in the sales of A in the year 2000 over 1995?
(a) 90%
(b) 60%
(c) 80%
(d) 50%
Q.7. Find the CAGR with which the market has grown for the period 1995-2000?
(a) 18%
(b) 10%
(c) 5%
(d) 12%
Q.8. If the new entrant F has grown at the expense of B, C, and E, what would be the change in the net value of sales of E in the year 2000, had F not entered the market?
(a) $ 111 million
(b) $ 340 million
(c) $ 247 million
(d) Cannot be determined
Q.9. What is the increase in sales in $ million) of A, B and C put together, over the 5 years period?
(a) 103
(b) 1202
(C) 668
(d) 854
Q.10. If the market grows at 10% p.a. over the next 2 years and D captures 1/3rd of the new market, what would be its market share in 2002?
(a) 29%
(b) 27%
(c) 25%
(d) 32%
Directions for questions 11 to 17: Refer to the following pie charts and solve the questions based on it.
Electricity Consumption by Sector
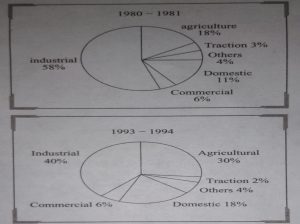
Q.11 By what percentage has the consumption of electricity by agriculture increased in 1993-1994 over 1980-1981?
(a) 66%
(b) 33%
(c) 133%
(d) Cannot be determined
Q.12 The electricity consumption of how many sectors has definitely increased over the given period?
(a) 2
(b) 3
(C) 4
(d) Cannot be determined
Q.13 If the total electricity consumption in 1993–94 is 1.2 times of the total electricity consumption in 1980-1981, then how many sectors have definitely increased by more than 50% during the same period?
(a) 1
(b) 2
(c) 3
(d) 4
Q.14 If the total electricity consumption in 1993-1994 is 1.5 times of the total electricity consumption in 1980–1981, then what is the percentage increase in the electricity consumption of the agricultural sector in the given period?
(a) 50%
(b) 100%
(C) 150%
(d) None of these
Q.15 What is the minimum number of sectors required to be added up in order to be more than 50% of the consumption for the period in 1993–1994?
(a) 1
(b) 2
(c) 3
(d) 4
Q.16 The agricultural consumption of electricity doubled from 1980-81 to 1993–94. By how much percentage has the total electricity consumption grown from 1980-81 to 1993-94?
(a) 20%
(b) 25%
(c) 50%
(d) Cannot be determined
Q.17. If the electricity consumption of the ‘others’ category has remained constant over the period, then what is the percentage increase in the electricity consumption of the domestic category?
(a) 63%
(b) 38%
(C) 58%
(d) Cannot be determined
Directions for questions 18 to 23: Refer to the following pie charts and solve the questions based on it.
The two pie charts given below provide the expenses of two families:
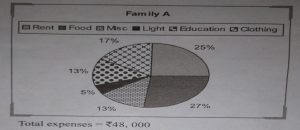
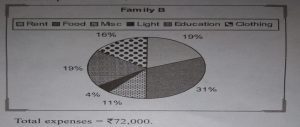
Q.18 Both the families decide to double the total expenditure keeping the pattern of spending the same as given above. What will be the new ratio of expenditure on food between family A and family B?
(a) 27:31
(b) 31:27
(c) 2:3
(d) 3:2
Q.19 If the total expenses of family B increase three-fold, keeping the expenses on education the same as given above, what will be the expense on education?
(a) 6.33%
(b) 57%
(C) 19%
(d) None of these
Q.20 What will be the expenses on light by family A, as a percentage of expense on light by family B?
(a) 120%
(b) 83.33%
(C) 62.5%
(d) 66.66%
Q.21 If family A and family B decide to combine their expenses, then which one of the following heads will be responsible for the highest expenses?
(a) Rent
(b) Miscellous
(c) Food
(d) Education
Q.22 In the above question, how many heads will have a lower percentage share in the combined total expenses of both the families than the percentage share of family B under the same head?
(a) 1
(b) 2
(C) 3
(d) 4
Q.23 Under how many heads are the expenses of family B more than the expenses of family A?
(a) Less than 3
(b) More than 3
(c) Equal to 3
(d) Cannot be determined
Directions for questions 24 to 30: Refer to the following pie charts and solve the questions based on it.
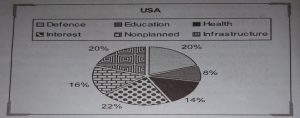
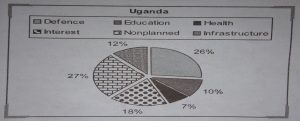
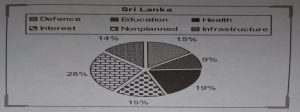
The following pie charts represent the budget expenditure of certain countries on various sectors for in 2007:
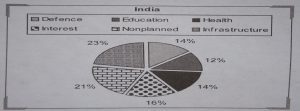
Q.24 A country is said to be progressive if its education, health and infrastructure expenditures are in the top four expenditure sectors. How many of the four
countries are progressive?
(a) 0
(b) 1
(c) 2
(d) 3
Q.25. A country is said to be developing if its combined expenditure on education, health and infrastructure is at least 50% of the total expenditure. How many of the four countries are developing nations?
(a) 0
(b) 1
(c) 2
(d) 3
Q.26 If a country is under military rule, it will spend maximum on defence and minimum on either health or education. How many of the above countries are under military rule?
(a) 0
(b) 1
(c) 2
(d) Cannot be determined
Q.27 Which of the following sectors will have same ranking in the countries budget expenditures?
(a) Non-planned
(b) Education
(c) Health
(d) None
Q.28 If the budgetary expenditures of all the four countries are combined, which sector will account for the maximum expenditure?
(a) Non-planned
(b) Interest
(c) Defence
(d) Cannot be determined
Q.29 The total budgetary expenditure of USA is four times the total budgetary expenditure of India, and the population of India is twice the population of USA. Then the per capita budgetary expenditure of USA is how many ….. times per capita expenditure
of India.
(a) 8
(b) 4
(c) 1/8
(d) 1/4
Q.30 The total budgetary expenditure of Sri Lanka is twice the total budgetary expenditure of Uganda. Under how many sectors is the budgetary expenditure in Uganda more than the budgetary expenditure in SriLanka?
(a) 0
(b) 1
(c) 2
(d) 3
Answer key:
1.d | 2.a | 3.d | 4.c | 5.b | 6.a | 7.b | 8.d | 9.c | 10.a | 11.d | 12.d | 13.b | 14.c | 15.b | 16.a | 17.a | 18.a | 19.a | 20.b | 21.c | 22.b | 23.b | 24.a | 25.a | 26.d | 27.d | 28.d | 29.a | 30.a
bellCAT’s Kolkata cat coaching has designed this pie chart test directly based on the CAT pattern and provided an answer key, too, for your help. For further queries, don’t hesitate to drop us a mail at .