Directions for questions 1 to 7: Refer to the following bar graph and solve the questions based on it.
The following bar chart shows the monthly expenditure of a family comprising of five persons over a period of seven months during three different years.
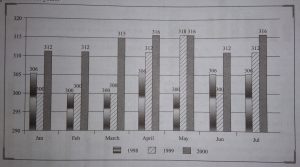
Q.1. In any of the given years, which month sees the maximum percentage increase in expenses with respect to the previous month?
(a) February
(b) March
(c) April
(d) June
Q.2. What is the average monthly expenditure of the whole family in the year 2000?
(a) Rs. 3,14,000
(b) Rs .3,15,000
(c) Rs. 3,16,000
(d) Cannot be determined
Q.3. In April 2000, what was the percentage increase in expenditure over April 1999?
(a) 1.2%
(b) 2%
(C) 6%
(d) 9.4%
Q.4. Which period has shown the same change in trend across all the given three years?
(a) February-March
(b) May-June
(c) March-April
(d) January-February
Q.5. Which of the following statements is correct?
(a) In 1998, May-June were the two consecutive months during which the expenditure was the maximum.
(b) During May-June 1999, the expenditure was the maximum for the year.
(c) Expenditure during January-February was the same in 1998 as well as in 1999.
(d) None of these
Q.6. For how many months of the given years the expenditure has been consistently increasing or decreasing?
(a) 0
(b) 1
(c) 2
(d) 3
Q.7. Out of the following months in the options, Which month accounts for the maximum combined expenditure for three years?
(a) March
(b) May
(c) June
(d) February
Directions for questions 8 to 14: Refer to the following bar graph and solve the based on it.
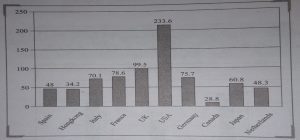
The bar chart given below represents top 10 exporters and their export value (in billion $) in 2008.
Q.8. If India also joins the top ten exporters list by becoming the 11th largest exporter, then what will be the effect on the average exports of these 11 countries; provided the export value of India is $ 10 billion?
(a) The average will increase by 1 billion dollars
(b) The average will decrease by 1 billion dollars
(c) The average will increase by 1.1 billion dollars
(d) None of these
Q.9. The ratio of exports between Spain and Japan is (approximately)
(a) 3:4
(b) 19:15
(c) 15:19
(d) 4:5
Q.10. What is the average export of all the countries in billion dollars for the year 2008?
(a) 77.66
(b) 76.76
(c) 76.67
(d) Cannot be determined
Q.11. If the exchange rate per dollar is 343 then find the difference between the values of exports by Hong Kong and UK in Rupee.
(a) 28.179 x 10⁹
(b) 28.179 x 10¹⁰
(c) 28.079 x 10¹⁰
(d) 28.079 x 10¹¹
Q.12. If the average export of the top ten exporters is calculated how many of the top ten exporting countries have higher export than this average?
(a) 3
(b) 4
(c) 5
(d) Cannot be determined
Q.13. If the average export of the top ten exporters is calculated, how many countries have higher export than this average?
(a) 3
(b) 4
(c) 5
(d) Cannot be determined
Q.14. To fight the US hegemony, the countries have decided to merge their operations by adding their exports value. What is the minimum number of countries needed to merge their operation so that their combined exports is more than the exports value of the US? (None of these ten countries export to each other.)
(a) 3
(b) 4
(c) 5
(d) None of these
Directions for questions 15 to 20: Refer to the following bar graph and solve the questions based on it.
Amount of production and sales by a company over the years (in lacs tonnes)
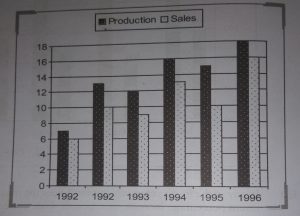
Q.15. What is the difference between the sales of 1993 and 1995 (in thousand tonnes)?
(a) 1000
(b) 50
(c) 100
(d) 500
Q.16. Total sales of 1991 and 1992 together are approximately what percentage of the sales in 1994?
(a) 120%
(b) 100%
(c) 50%
(d) 200%
Q.17. What is the approximate percentage increase in production from 1993 to 1994?
(a) 20%
(b) 33%
(c) 70%
(d) 100%
Q.18. The percentage of sales to production is maximum in which of the following years?
(a) 1992
(b) 1994
(c) 1996
(d) 1991
Q.19. What is the percentage drop in sales from 1992 to 1993?
(a) 5%
(b) 40%
(c) 10%
(d) 60%
Q.20. In which year is the difference between the production and sales the maximum?
(a) 1992
(b) 1993
(c) 1995
(d) 1996
Directions for questions 21 to 25: Refer to the following bar graph and solve the questions based on it.
The following bar chart gives the cumulative percentage of five different types of bikes produced by Kajaj during the given two years:
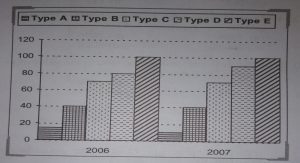
Total Bikes produced in 2006 is 4,50,000.
Total bikes produced in 2007 is 520,000,
Q.21. What is the difference in the production of the C type bikes between 2006 and 2007?
(a) 5,000
(b) 7,500
(c) 10,000
(d) None of these
Q.22. If 85% of the E type bikes produced during 2006 and 2007 are being sold by the company, then how many E type bikes are left unsold?
(a) 1,42,800
(b) 21,825
(c) 29,100
(d) 21,300
Q.23. What is the approximate percentage share of the A type bikes in the total production of (2007 + 2006)?
(a) 11
(b) 13
(c) 15
(d) 9
Q.24. In the case of which of the following types of bikes is the percentage increase from 2006 to 2007 the maximum?
(a) A
(b) E
(c) D
(d) B
Q.25. Assuming that the data points are in the multiples of 5, production of B type bikes in 2007 is what percentage of total bikes produced in 2007?
(a) 30%
(b) 40%
(c) 35%
(d) 25%
Directions for questions 26 to 30: Refer to the following bar graph and solve the based on it.
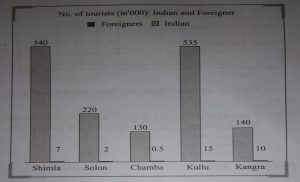
The bar graph given below shows the five districts of the state of Himachal Pradesh and the number of tourists visiting them. For the given bar chart, total number of Indian tourists is more that the total number of foreign tourists. None of the tourists can be Indian as well as foreigner.
Q.26. By what percentage are the Indian tourists visiting Chamba less than those visiting Shimla?
(a) 30%
(b) 50%
(C) 60%
(d) 75%
Q.27. Approximately what percentage of the total tourists visiting Himachal Pradesh are foreigners?
(a) 2%
(b) 8%
(c) 4%
(d) 5%
Q.28. What is the ratio between the Indian tourists and the foreign tourists visiting Kullu?
(a) 105:3
(b) 70 : 3
(C) 107:3
(d) 35:1
Q.29. Which of the following districts has the maximum ratio of Indian and foreign tourists?
(a) Shimla
(b) Solon
(c) Chamba
(d) Kangra
Q.30. Which of the following districts has the minimum ratio of Indian and foreign tourists?
(a) Shimla
(b) Solon
(c) Chamba
(d) Kangra
Directions for questions 31 to 35: Refer to the following bar graph and solve the questions based on it.
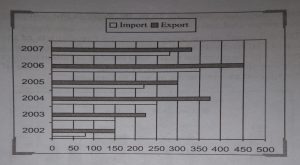
The following bar charts represents the value of exports and imports (in crores) of a country for the given period:
(All the values in the above bar chart are the multiples of 10).
Q.31 The value of exports in 2006 was what percentage of the average value of imports in the years 2004, 2005 and 2007?
(a) 200%
(b) 100%
(c) 150%
(d) None of these
Q.32. The value of exports in 2004 was exactly what percentage of the value of imports in the same year?
(a) 200%
(b) 100%
(C) 150%
(d) None of these
Q.33. What is the approximate difference (in crores) between the average exports and the average imports for the given years?
(a) 65
(b) 85
(c) 105
(d) 135
Q.34. In which year is the difference between the exports and the imports closest to 100 crores?
(a) 2005
(b) 2006
(C) 2007
(d) 2008
Q.35. What is the percentage increase in the value of exports in 2006 over 2005?
(a) 30%
(b) 50%
(c) 90%
(d) 120%
Answer key
1.c | 2.d | 3.a | 4.c | 5.d | 6.b | 7.b | 8.d | 9.d | 10.d | 11.d | 12.a | 13.a | 14.a | 15.c | 16.a | 17.b | 18.c | 19.c | 20.c | 21.d | 22.d | 23.b | 24.c | 25.a | 26.d | 27.a | 28.c | 29.c | 30.d | 31.d | 32.c | 33.b | 34.b | 35.b
Our CAT coaching Kolkata hopes that you found this article helpful. You can always get in touch with our team if you have any doubts.